class: center, middle, inverse, title-slide # Shows and Television ### Zach Mullis, Ben Tibbits ### Last compiled: Apr 27, 2021 --- # Introduction * With streaming services on the rise its getting more difficult to pick between them and too expensive to pay for all of them * There are numerous articles discussing which streaming service is best, but we found no studies using statistical methods comparable to ours * Research Question: What is the best streaming service? * Four contenders: Netflix, Hulu, Prime Video, and Disney+ * Determined by XC scoring system of three criteria: 1. Amount of content compared to price 2. Percent of exclusive content 3. Quality of content --- # Media1 Data ``` ## # A tibble: 4,302 x 5 ## Title Year Age IMDb RT ## <chr> <dbl> <fct> <dbl> <dbl> ## 1 Inception 2010 13+ 8.8 8.7 ## 2 The Matrix 1999 18+ 8.7 8.7 ## 3 Avengers: Infinity War 2018 13+ 8.5 8.4 ## 4 Back to the Future 1985 7+ 8.5 9.6 ## 5 The Good, the Bad and the Ugly 1966 18+ 8.8 9.7 ## 6 Spider-Man: Into the Spider-Verse 2018 7+ 8.4 9.7 ## 7 The Pianist 2002 18+ 8.5 9.5 ## 8 Django Unchained 2012 18+ 8.4 8.7 ## 9 Raiders of the Lost Ark 1981 7+ 8.4 9.5 ## 10 Inglourious Basterds 2009 18+ 8.3 8.9 ## # … with 4,292 more rows ``` * This is a tibble of our media1 data using the first 5 entries. We aggregated this data using previously developed datasets published on Kaggle.com using a Public Domain or Creative Commons license. After omitting NAs we had a sample size of 4,302. We also averaged ratings between IMDb and Rotten Tomatoes which we called Score. --- # Media5 Data ``` ## # A tibble: 10 x 8 ## Title Year Age IMDb RT Score Type Service ## <chr> <dbl> <fct> <dbl> <dbl> <dbl> <fct> <fct> ## 1 Inception 2010 13+ 8.8 8.7 8.75 Movie N--- ## 2 The Matrix 1999 18+ 8.7 8.7 8.7 Movie N--- ## 3 Avengers: Infinity War 2018 13+ 8.5 8.4 8.45 Movie N--- ## 4 Back to the Future 1985 7+ 8.5 9.6 9.05 Movie N--- ## 5 The Good, the Bad and the Ugly 1966 18+ 8.8 9.7 9.25 Movie N--P- ## 6 Spider-Man: Into the Spider-Verse 2018 7+ 8.4 9.7 9.05 Movie N--- ## 7 The Pianist 2002 18+ 8.5 9.5 9 Movie N--P- ## 8 Django Unchained 2012 18+ 8.4 8.7 8.55 Movie N--- ## 9 Raiders of the Lost Ark 1981 7+ 8.4 9.5 8.95 Movie N--- ## 10 Inglourious Basterds 2009 18+ 8.3 8.9 8.6 Movie N--- ``` * We then created `Service` by writing a function creatively named `makeservice` that essentially combined the platform columns from the original data. --- ### Regression Tree <div class="figure"> <img src="RT.png" alt="Score ~ . - RT - IMDb, media_NT" width="100%" /> <p class="caption">Score ~ . - RT - IMDb, media_NT</p> </div> --- # Anova that we can't use ```r trmod <- aov(Score ~. - RT - IMDb, media_NT) anova(trmod) ``` ``` ## Analysis of Variance Table ## ## Response: Score ## Df Sum Sq Mean Sq F value Pr(>F) ## Year 1 0.1 0.10 0.0384 0.844648 ## Age 4 448.4 112.11 42.2577 < 2.2e-16 *** ## Netflix 1 68.3 68.33 25.7559 4.038e-07 *** ## Hulu 1 259.6 259.62 97.8598 < 2.2e-16 *** ## Prime.Video 1 77.5 77.53 29.2227 6.802e-08 *** ## Disney 1 23.0 23.00 8.6684 0.003255 ** ## Type 1 839.9 839.86 316.5702 < 2.2e-16 *** ## Residuals 4291 11384.0 2.65 ## --- ## Signif. codes: 0 '***' 0.001 '**' 0.01 '*' 0.05 '.' 0.1 ' ' 1 ``` --- # QQ-Plot ```r qqnorm(media1$Score, main = "Score") qqline(media1$Score) ``` 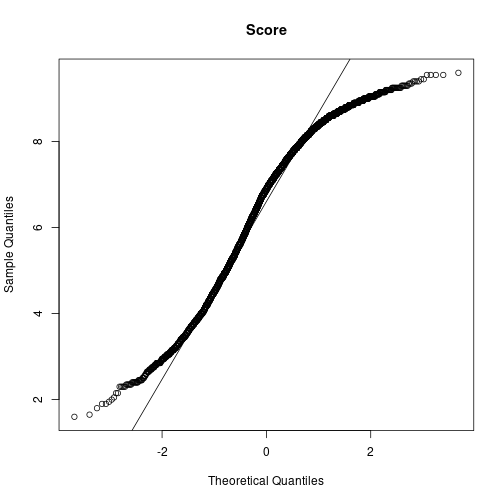<!-- --> --- # Shapiro Wilks ```r shapiro.test(media1$Score[1:5000]) ``` ``` ## ## Shapiro-Wilk normality test ## ## data: media1$Score[1:5000] ## W = 0.95355, p-value < 2.2e-16 ``` * Given that the `\(H_0\)` for the Shapiro-Wilks test is that the distribution is normal, and our p-value is far below a reasonable `\(\alpha\)` level, we reject the null. There is evidence that the data is non-normal. --- # Kruskal-Wallis ``` ## ## Kruskal-Wallis rank sum test ## ## data: Score by Service ## Kruskal-Wallis chi-squared = 226.3, df = 12, p-value < 2.2e-16 ``` `$$H_0: \mu_1 = \mu_2$$` `$$H_A: \mu_1 \neq \mu_2$$` * With a p-value far below a reasonable `\(\alpha\)`, we reject the Null hypothesis. There is evidence that the location parameters ( `\(\mu\)` ) in `Score` and `Service` have at least one difference. --- # Amount of content compared to price # Streaming Data ``` ## Services Price Content C/P Exclusives E/C Score ## 1 Netflix 8.99 5491 610.7898 4936 0.8989255 6.759397 ## 2 Hulu 11.99 2657 221.6013 2091 0.7869778 7.211160 ## 3 Prime Video 8.99 14498 1612.6808 13647 0.9413022 6.217407 ## 4 Disney+ 7.99 744 93.1164 688 0.9247312 6.483876 ``` * Here we break it down by Platform --- # Streaming Scatterplot 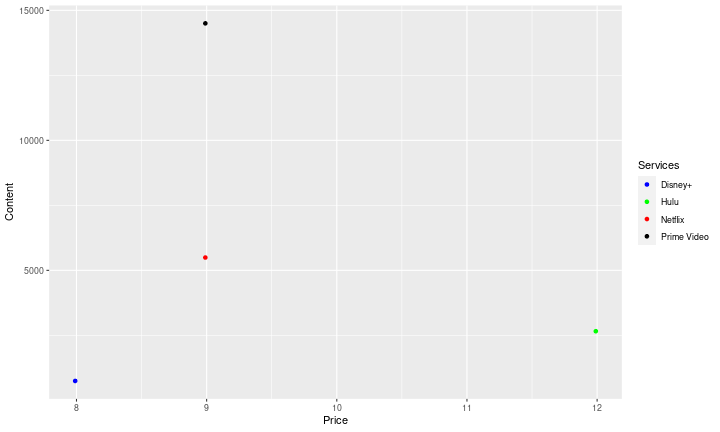<!-- --> --- # Percent of exclusive content ``` ## Services Price Content C/P Exclusives E/C Score ## 1 Netflix 8.99 5491 610.7898 4936 0.8989255 6.759397 ## 2 Hulu 11.99 2657 221.6013 2091 0.7869778 7.211160 ## 3 Prime Video 8.99 14498 1612.6808 13647 0.9413022 6.217407 ## 4 Disney+ 7.99 744 93.1164 688 0.9247312 6.483876 ``` 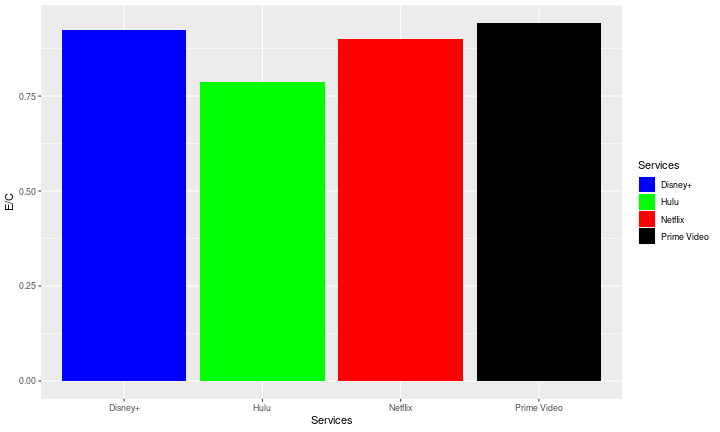<!-- --> --- # Quality of content ``` ## Services Price Content C/P Exclusives E/C Score ## 1 Netflix 8.99 5491 610.7898 4936 0.8989255 6.759397 ## 2 Hulu 11.99 2657 221.6013 2091 0.7869778 7.211160 ## 3 Prime Video 8.99 14498 1612.6808 13647 0.9413022 6.217407 ## 4 Disney+ 7.99 744 93.1164 688 0.9247312 6.483876 ``` 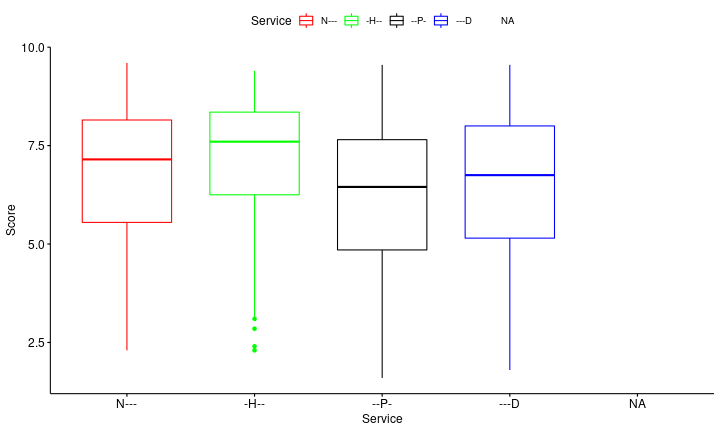<!-- --> --- # Results ``` ## Services Price Content C/P Exclusives E/C Score ## 1 Netflix 8.99 5491 610.7898 4936 0.8989255 6.759397 ## 2 Hulu 11.99 2657 221.6013 2091 0.7869778 7.211160 ## 3 Prime Video 8.99 14498 1612.6808 13647 0.9413022 6.217407 ## 4 Disney+ 7.99 744 93.1164 688 0.9247312 6.483876 ``` ``` ## Services C.P E.C Quality Final ## 1 Netflix 2 3 2 7 ## 2 Hulu 3 4 1 8 ## 3 Prime Video 1 1 4 6 ## 4 Disney+ 4 2 3 9 ``` #### 1st: Prime Video #### 2nd: Netflix #### 3rd: Hulu #### 4th: Disney+ --- # Thanks! Any questions?